* Acquisition of Orion EU project subject to shareholder approval at AGM to be convened 29 October 2024

Project Overview

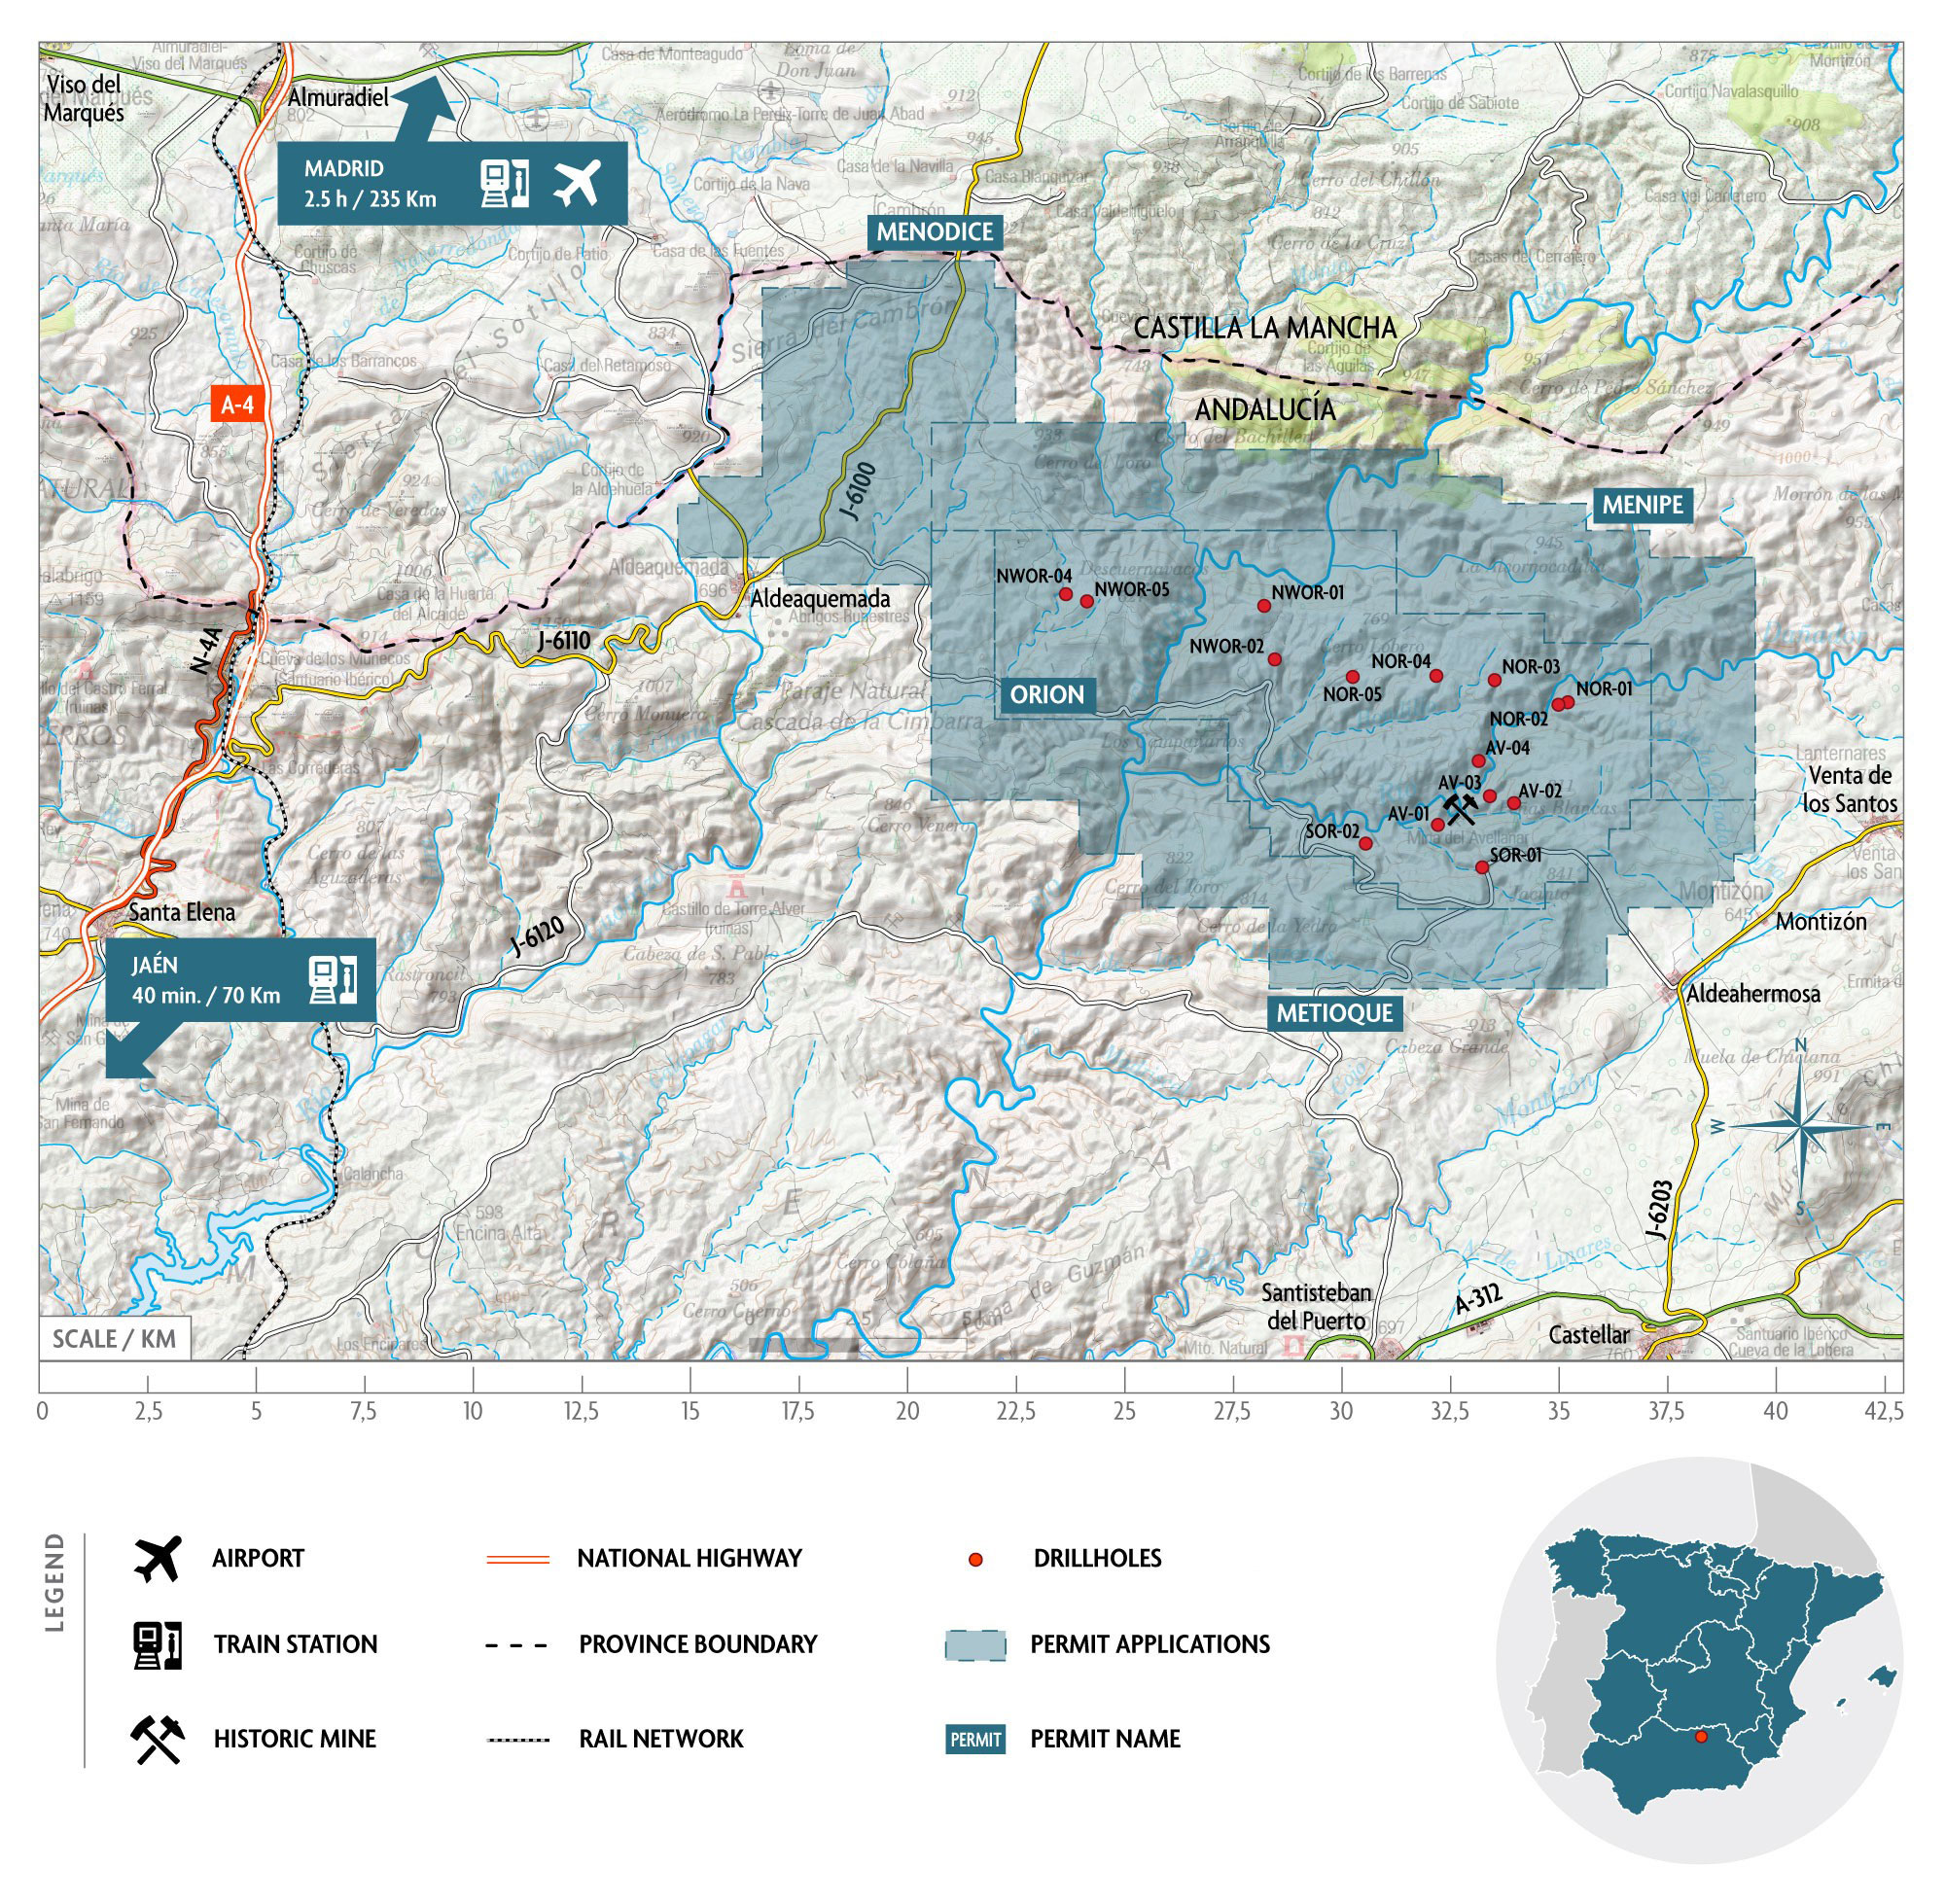
The Orion EU Critical Minerals Project (the Project) is located in Jaén Province, Andalucía, Southern Spain (refer Figure 1). The Project includes 288 Spanish mining units (cuadrículas mineras) covering an area of 86.4km2.

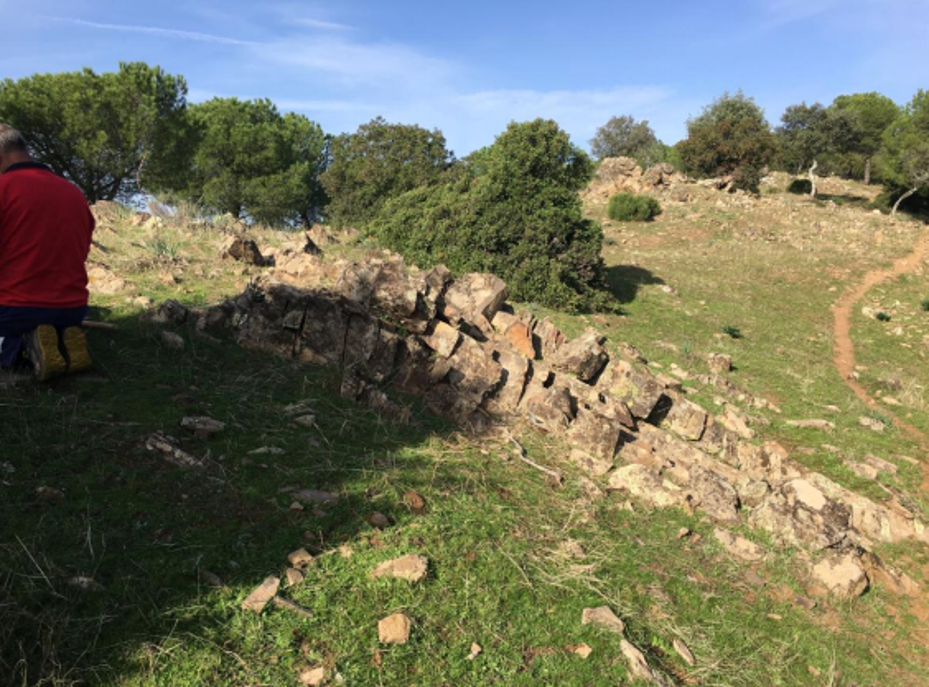
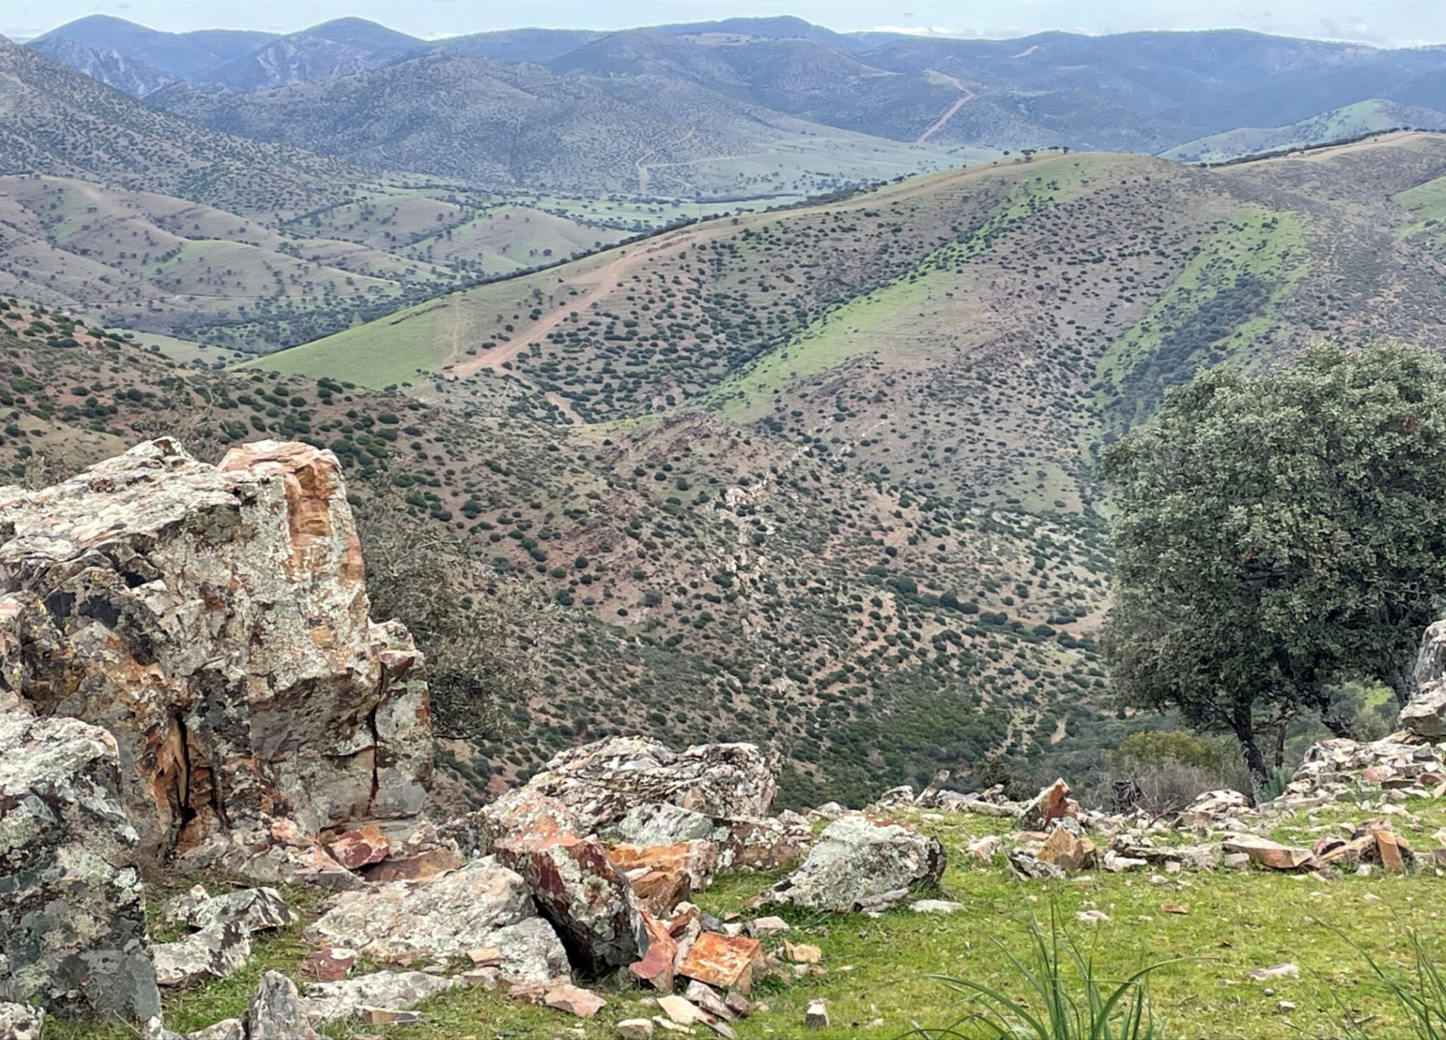
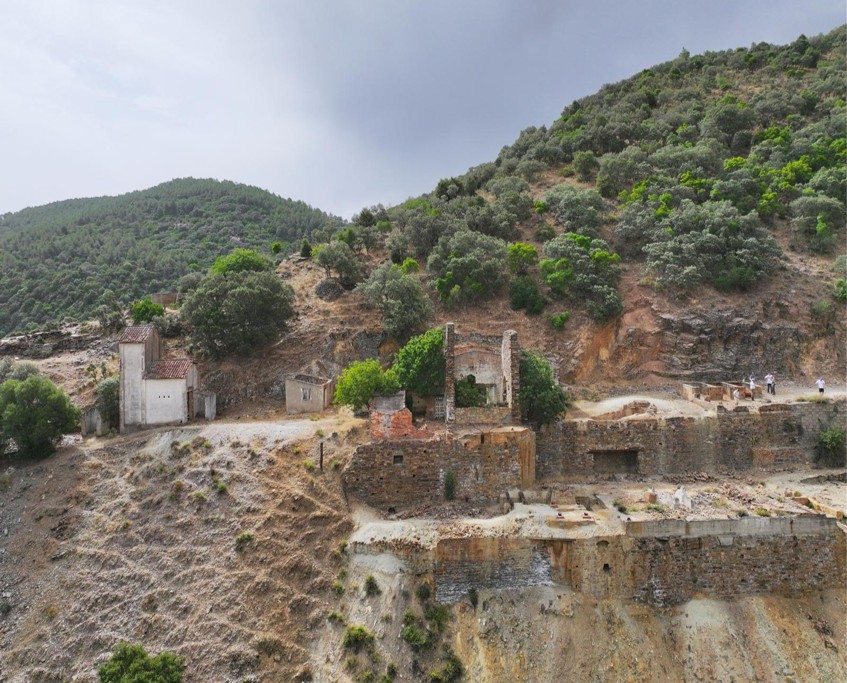
It is a siliciclastic geological system with various layers rich in critical minerals including rutile (titanium), zircon, hafnium, and light and heavy rare earths. The Project area was explored for thorium and uranium in the 1950s and 1960s and includes a historic galena mine (refer Figure 2). Three initial target areas have been identified with a focus on the Avellanar target (refer Figure 3) that includes the exploration results referred to below. The “Admisión Definitiva” (main pre-cursor to permit award) was published in the “Boletín Oficial de la Provincia de Jaén” (Province Bulletin) in March 2024 with formal permit award expected in Q4, CY24.

Figure 1: – Map showing Orion EU Critical Minerals Project location

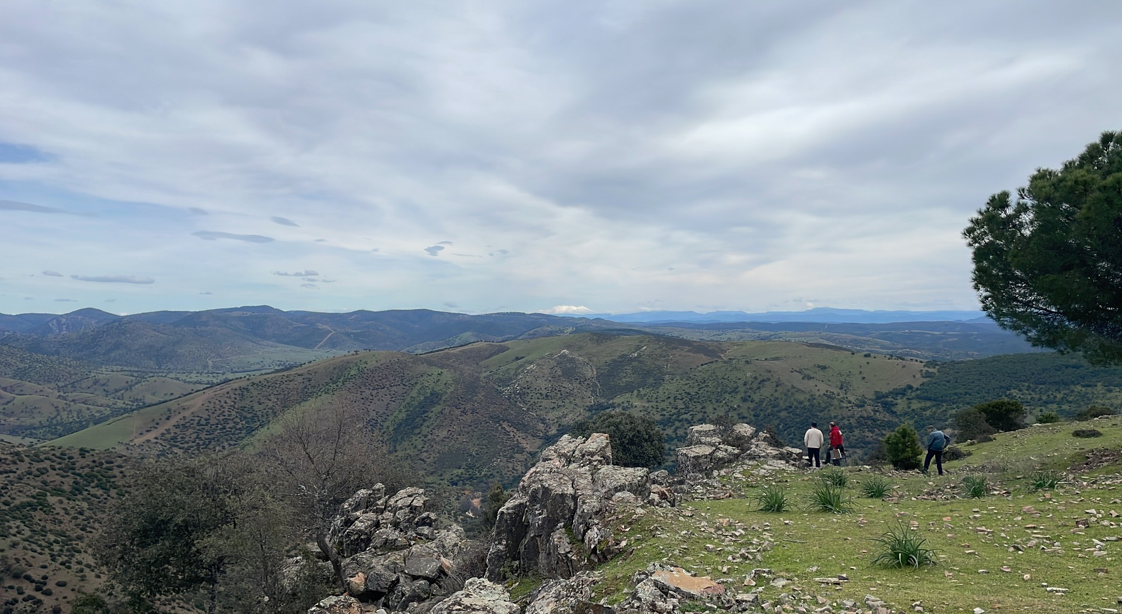
Figure 2a: Photo on location at Avellanar Zone showing remnants of historic galena mine in the permit area

Figure 2b: Photo on location at Avellanar Zone showing remnants of historic galena mine in the permit area

Figure 3: Map showing three Target Areas within the Permit Boundary

Figure 1: – Map showing Orion EU Critical Minerals Project location

Figure 3: Map showing three Target Areas within the Permit Boundary

Exploration Activities

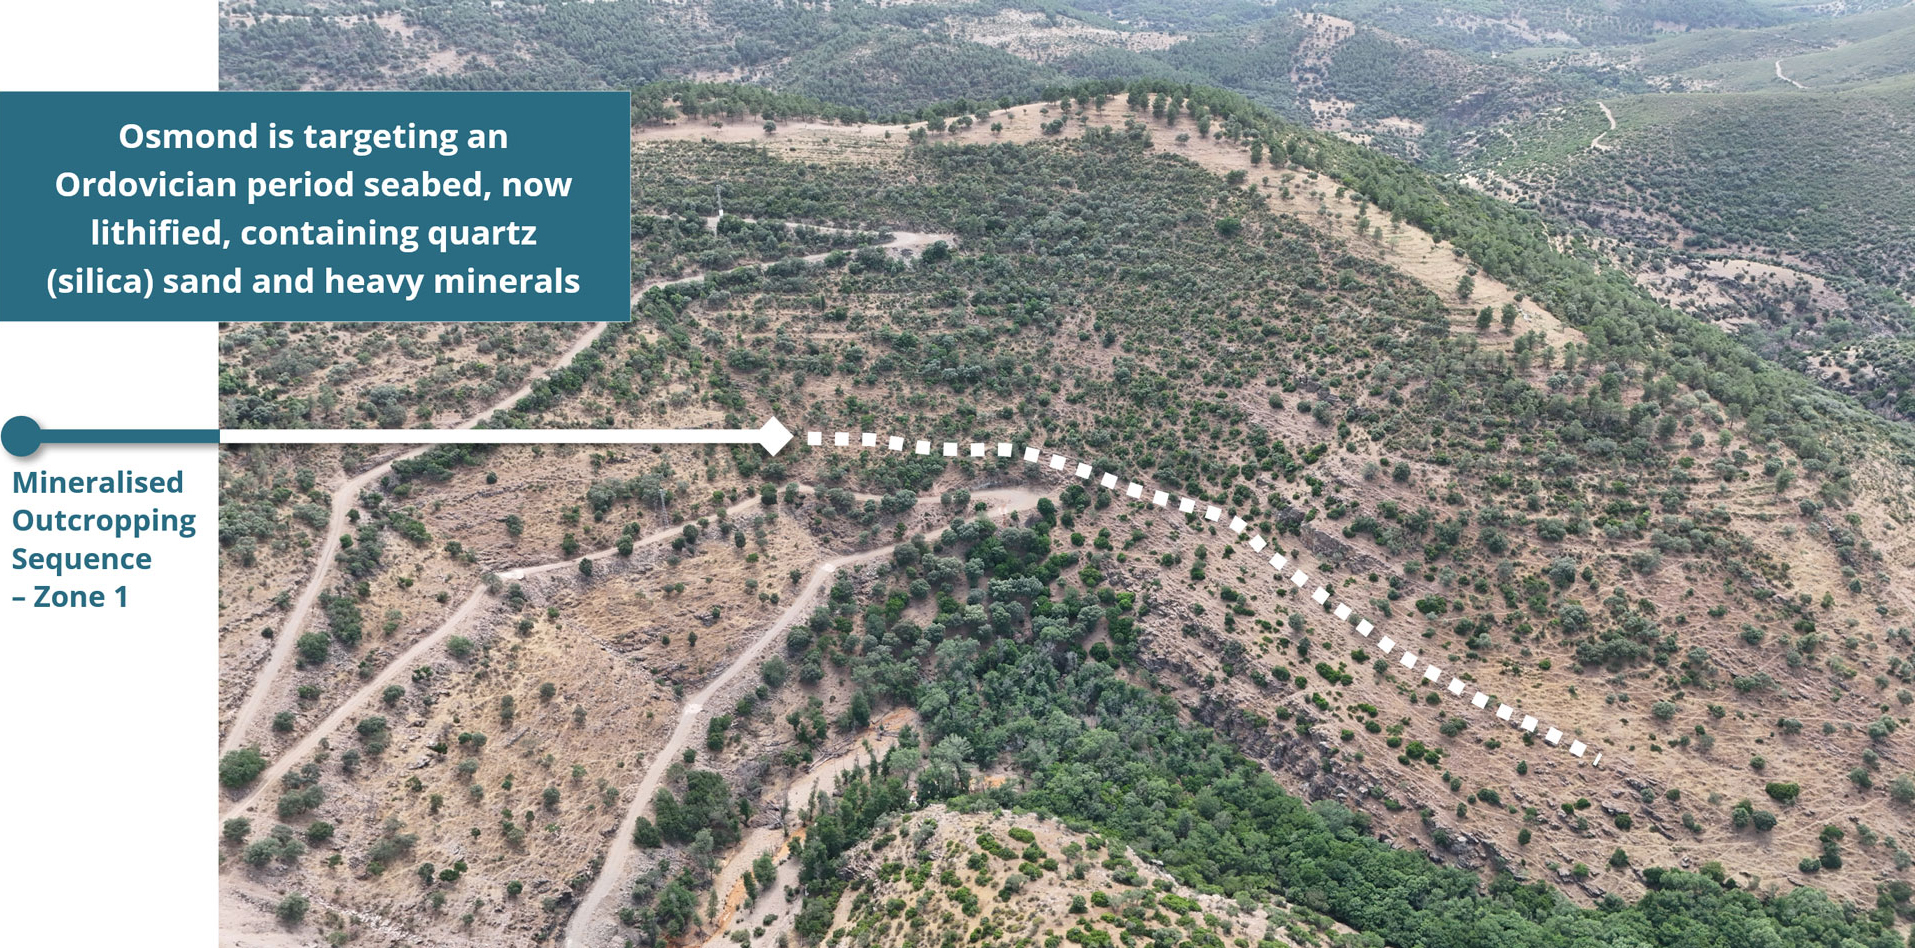
Exploration activities to date have focused on mapping and sampling the TI-ZR-REE rich layers across a wide area of the Avellanar Target. Figure 4 and Figure 5 show detailed geology and cross sections over the Avellanar Target, indicating in red colour the rich TI-Zr-REE layers that extend over more than 2km in an east west direction. The layers are sub horizontal, dipping north and thickness ranges between two and four metres with good continuity in the mineralized layers observed. A sampling campaign followed by a channel bulk sampling was undertaken to cover the entire 2km outcropping layer.

Figure 4: Map showing detailed geology and mineralized layers in Avellanar Zone

Figure 5: Schematic cross sections over Avellanar Zone showing in red the rich Ti-Zr-REE layers

Exploration Results

Green Mineral Resources SL has completed two rounds of modern exploration activities in the Avellanar Zone (refer to Figure 3 above):

  1. Sixteen rock chip samples (chip sampling) from outcrops across more than 2kms; and
  2. Three channel samples across the complete layer thickness weighing 150 kg to get a bulk sample.

Figures 6 and 7 show the locations of the chip samples and bulk samples within the Avellanar Zone.

Figure 6: Map showing chip sampling (red points) and Channel Bulk Channel Sample locations (green points) within Avellanar Zone

Figure 7: Photo showing selected outcrops and geological interpretation of potential mineralised sequence

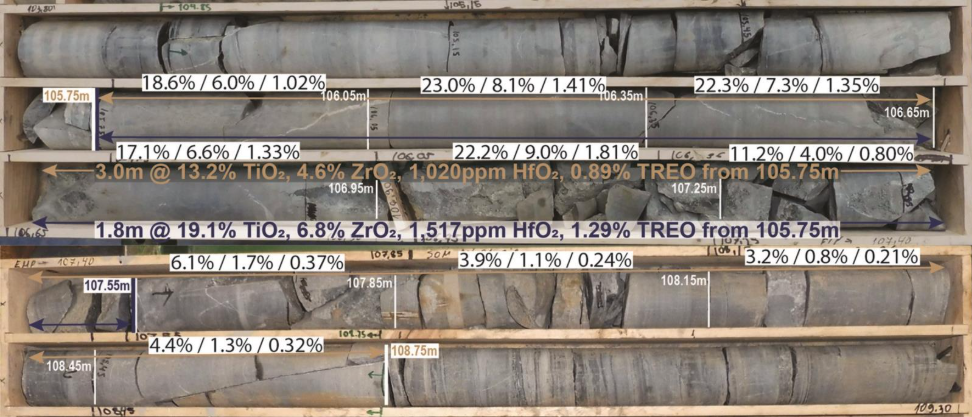
The rock chip sampling was designed to test relevant element and oxide grades in the outcrops detected by a scintillometer. Samples of approximately 500 grams were collected, prepared and sent to ALS Labs in Seville, Spain for crushing and splitting prior to being shipped to ALS Labs in Galway, Ireland for assay. Select results are shown in Table 1 below.

The bulk sampling across three different outcrops at the main sandstone layer was designed to confirm grades along the complete seam, determine mineral species and to consider initial processing routes with respect to grinding size and liberation. 150kgs of material was taken from three different outcrops. Samples were collected, bagged in plastic and sent to SGS Labs in Galicia, Spain to be shipped to SGS Labs in Toronto, Canada for crushing, pulverizing and splitting before geochemical and technical assessment. Select results from the three samples are shown on Table 2 below

Table 1: Select Assay Results from 16 Chip Sampling

Select Assay Results of 16 Chip sampling
Oxide Unit AV-1 AV-8 AV-9 AV-10
Ti02 % 19.00 24.40 19.10 >30
Zr02 % 6.57 9.70 7.50 10.90
Hf02 ppm 1,539 2,353 1,598 2,618
Nd203 ppm 2,193 3,383 2,531 2,683
Pr203 ppm 616 868 697 769
Tb407 ppm 31 41 33 36
Dy203 ppm 149 195 162 173

Table 2: Select Modals and Oxide Results from 150kg Bulk Sample Program

Modals and Oxide Results from 150kg Bulk Sample
Mineral Unit Sample 1 Sample 2 Sample 3
Rutile % 13.26 13.16 15.22
Ilmenite % 6.02 4.69 5.05
Zircon % 9.28 8.44 9.37
Monazite % 1.54 1.50 1.72
Oxides
Hf02 ppm 1,219 1,160 1,297
Nd203 ppm 2,098 1,841 2,026
Pr203 ppm 591 499 548
Tb407 ppm 33 29 32
Dy203 ppm 159 140 153

With respect to initial process test works relating to grinding size and liberation, the chart below in Figure 8 presents encouraging early results suggesting a relatively clean mineral assemblage and a reasonable possibility of a low cost gravity circuit processing route.

Figure 8: Graph showing Sample 3 Cumulative Passing of Mineral Mass at Grain Size