Minerals Hub / Innovation & Technology / The microscope that maps minerals particle by particle
Innovation & Technology · 5 min read
The microscope that maps minerals particle by particle
How SEM-based automated mineralogy turns a polished slice of ore into a mineral map, what it tells an operation about its ore feed and products, and what a two-dimensional slice cannot tell it.
Reviewed by Peter Uppal
The short version
Place a polished section of ore or plant product in a scanning electron microscope fitted for automated mineralogy, and the system assigns a mineral, where it can, at each point it measures, using the backscattered-electron signal and an X-ray spectrum. From the resulting map it reports how much of each mineral is present, how liberated (free of other minerals) and associated (attached to which others) the grains are, and their sizes; a 2019 study says such systems are applied in the mining industry to quantify the mineralogy of ore feed and products. Because each map is a two-dimensional slice through three-dimensional particles, quantities such as grain size carry a stereological bias, the error of inferring three-dimensional sizes from a flat section.
How the map is built
The hardware is a familiar instrument with a particular detector. The automated mineralogy laboratory at the Colorado School of Mines describes the method as using scanning electron microscopy and energy-dispersive X-ray spectroscopy. A 2019 study by Warlo and co-authors puts it in terms of two signals: the systems utilize backscattered electrons (BSE) and energy dispersive X-ray spectra (EDS) to create digital mineral images.
The Mines page, describing its own instrument, sets out the sequence such systems follow. At each pixel the system collects a backscatter electron signal and an EDS spectrum; the spectra are compared with spectra held in a look-up table; and a mineral or phase is identified from the BSE value and elemental intensities.
A 2020 study by Ríos-Reyes and co-authors, using QEMSCAN, describes a refinement. The system first takes a BSE reading, and the beam dwells only where that brightness is above a set threshold, so the X-ray detectors can record a spectrum. In the finished map, each pixel represents an individual analysis point.
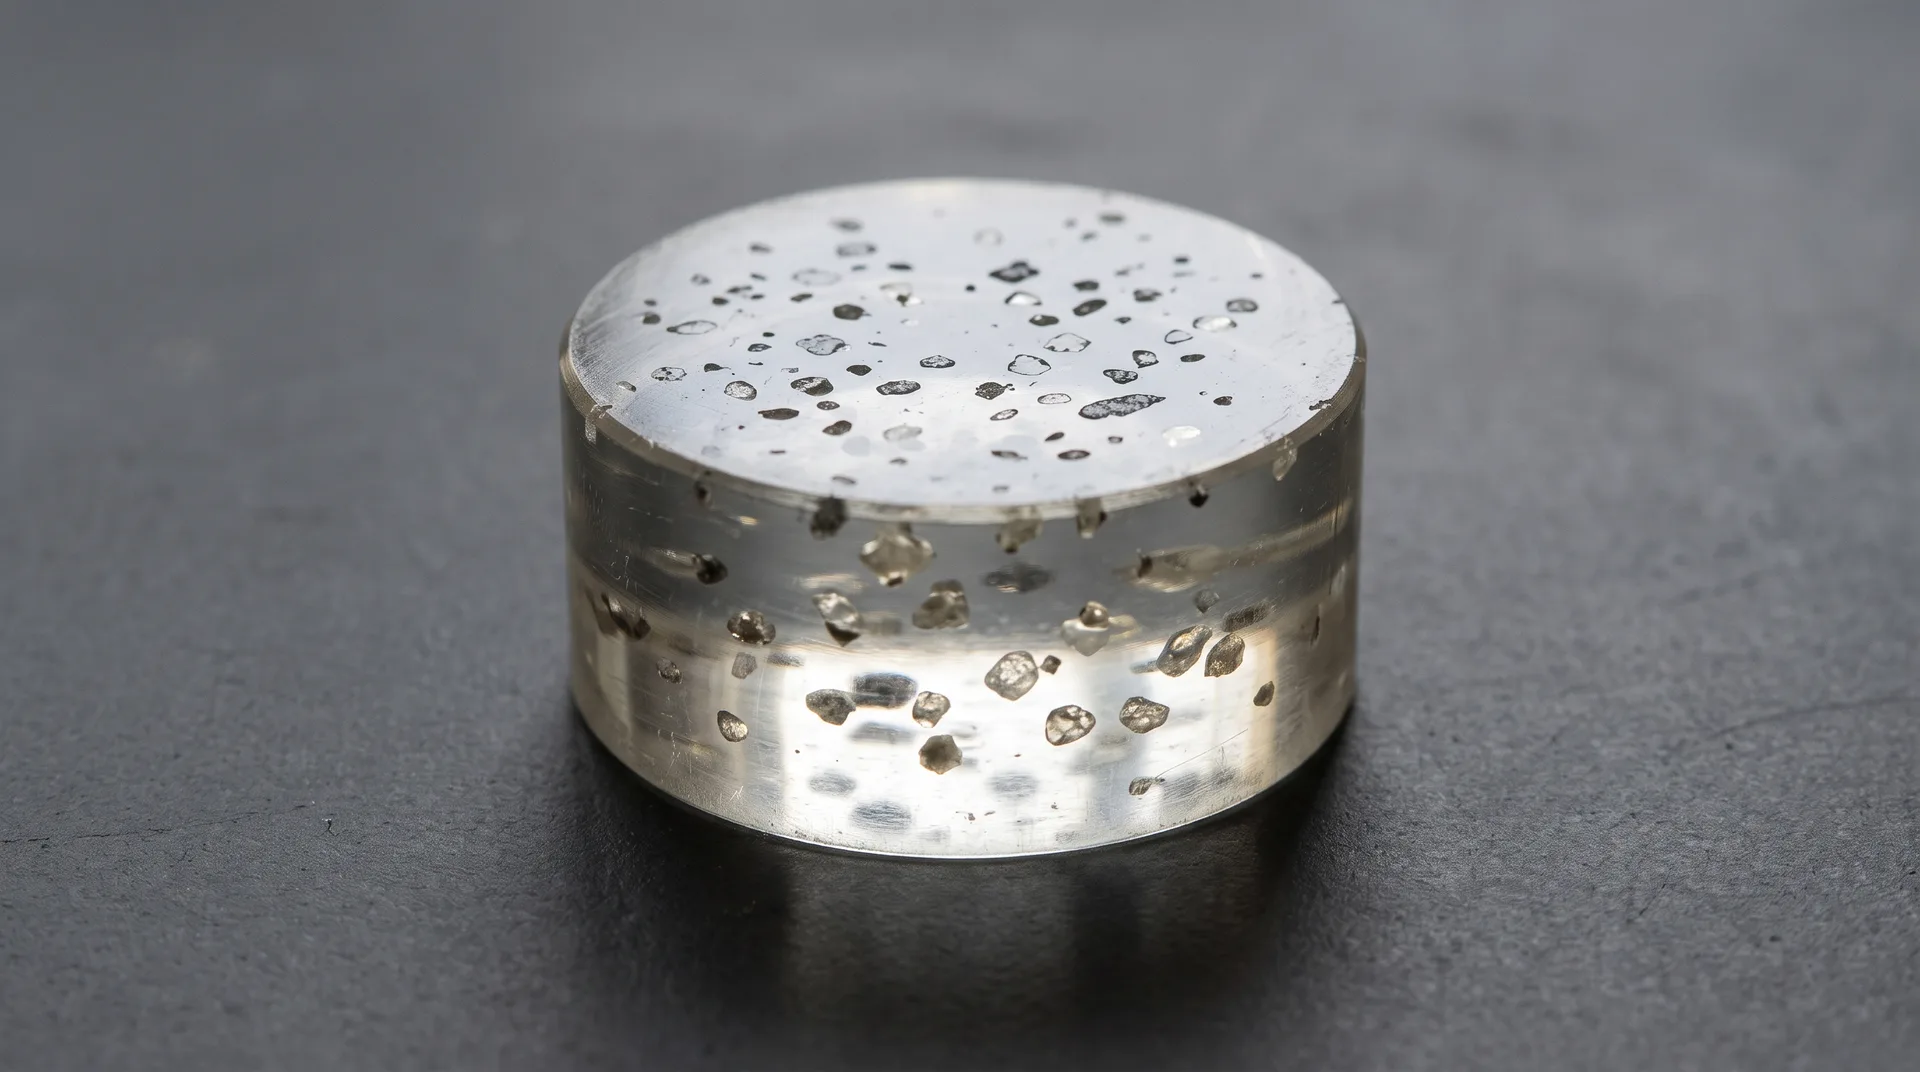
What goes under the beam is prepared first. The Mines laboratory takes polished resin blocks, standard thin sections, or coarse grains mounted on carbon tape, and lists particulate samples including mill products, sediment samples, and heavy mineral separates.
What it reports
The outputs are what make the method useful to a plant. The Mines page lists modal mineral abundance by mass and area, mineral locking (grains bound to others) and liberation, mineral association, and particle, grain and pore size distributions. Ríos-Reyes and co-authors add that QEMSCAN maps give particle and mineral grain size and shape, mineral associations, mineral liberation, and that its proportions are normalised to provide a quantitative 2-D modal mineralogy, that is, the proportions of each mineral in the plane of the section.
CSIRO, which developed QEMSCAN, puts the outcome in an operator's terms: the analysis establishes the percentage of each mineral in a sample, whether each is in an easily accessible form, and how much is recoverable economically. That last point is the developer's claim for its own technology.
Speed has a price. Warlo and co-authors say these systems provide fast and reliable quantification of the mineralogy and textures in a sample, then qualify it: instruments are typically calibrated for fast acquisition to allow high sample throughput, and this comes at the expense of precision and resolution.
How much of each mineral, how free it is, and what it is stuck to: three things the map reports.
The systems, as examples
Several commercial systems do this. In 2019 Warlo and co-authors named QEMSCAN and the Mineral Liberation Analyzer (MLA) as the most prominent, with newer systems most prominently the ZEISS Mineralogic Mining system and the TESCAN Integrated Mineral Analyzer. CSIRO describes QEMSCAN as a scanning electron microscope, four X-ray detectors and a software package that analyses metallurgical products size-by-size and particle-by-particle. Its account of the history is brief: the technology underpinning it is QEM*SEM, and QEMSCAN was commercialised by CSIRO's spin-off, Intellection, and taken over by FEI from 2009, as the page put it in 2018.
The approach is not confined to mines. Ríos-Reyes and co-authors describe SEM-based automated petrography as widely used in the mining, mineral processing, and petroleum industries.
On a plant's streams
Warlo and co-authors say that such systems are applied in mining to quantify the mineralogy of ore feed and products.
A 2018 study at the Namakwa Sands mineral-sands operation in South Africa shows how that fits beside other methods. Testing micro-CT on the operation's products, the authors note that the high purity grade of the ilmenite concentrate had been confirmed by chemical and QEMSCAN analyses. The 2018 study's authors judged QEMSCAN and MLA better suited than micro-CT for identifying mineral phases, and treated micro-CT as a possible supplementary tool still to be proven.
What a slice cannot show
The 2018 Namakwa study names one limit. Micro-CT works on volumes, which the authors describe as eliminating stereological bias as imposed by 2D QEMSCAN methodology. A 2016 conference abstract on MLA makes the point in general: stereological distortion remains in estimating 3D quantities from 2D measurements, and cutting effects usually cause an underestimation of grain size for isotropic grains. At best, the authors write, measurements can be precise, though not accurate for the sample as a whole.
Chemistry is the other limit. Warlo and co-authors list two cases the systems handle poorly: telling apart minerals of similar element composition, and fine textures with phases smaller than the excitation volume of the electron beam, the small region of the sample the beam excites, which commonly give mixed X-ray signals. Ríos-Reyes and co-authors say it cannot differentiate mineral phases with the same chemical composition. For mineral sands the problem is concrete: a 2020 review by Schulz, Sandmann and Gilbricht notes that leucoxene, although it still contains small amounts of iron (below 5% by weight), cannot be properly distinguished from rutile (TiO₂) by EDS and XRD spectra. The Mines page notes that the assignment makes no distinction between mineral species and amorphous grains of similar composition, and some points end up with no name at all, where no mineral definition was consistent with the measured spectra.
Access is a practical limit too. Ríos-Reyes and co-authors call the main disadvantage of QEMSCAN that it is a very expensive tool.
Related
- Digital Mining
- Ore Processing
- Processing Technology
- Research Organisations
- Exploration Technology
Sources
- PRIMARYWarlo, M., Wanhainen, C., Bark, G., Butcher, A. R., McElroy, I., Brising, D. and Rollinson, G. K., 'Automated Quantitative Mineralogy Optimized for Simultaneous Detection of (Precious/Critical) Rare Metals and Base Metals in A Production-Focused Environment', Minerals 9(7), 440, 2019, doi:10.3390/min9070440. Abstract and s 1 (systems named; BSE and EDS; use on ore feed and products; speed against precision); s 4 (similar compositions; fine textures).
- PRIMARYColorado School of Mines, Department of Geology and Geological Engineering, 'Automated Mineralogy Laboratory' method page, undated. Describes the laboratory's own instrument (a TESCAN Integrated Mineral Analyzer): per-pixel BSE and EDS acquisition, look-up-table classification, outputs, sample formats, and the limit on amorphous grains.
- PRIMARYCSIRO, 'QEMSCAN' page, last updated 10 December 2018. The developer's own account of the instrument, what its analysis establishes, and its commercial history (QEM*SEM; Intellection Pty Ltd; FEI Company from 2009). Institution usage.
- PRIMARYRíos-Reyes, C. A., Castellanos-Alarcón, O. M. and Villarreal-Jaimes, C. A., 'Automated petrography analysis by QEMSCAN® of a garnet-staurolite schist', Revista Mexicana de Ciencias Geológicas 37(1), 98–107, 2020, doi:10.22201/cgeo.20072902e.2020.1.1491. pp. 98–99 (use in industry; outputs; four EDS detectors); p. 101 (BSE reading and threshold; pixels as analysis points; 2-D modal mineralogy); pp. 102, 105 (unclassified points; same-composition phases; cost).
- PRIMARYRozendaal, A., Le Roux, S. G., du Plessis, A. and Philander, C., 'Grade and product quality control by microCT scanning of the world class Namakwa Sands Ti-Zr placer deposit, West Coast, South Africa: An orientation study', Minerals Engineering 116, 152–162, 2018, doi:10.1016/j.mineng.2017.09.001 (author copy). s 6.1 (ilmenite concentrate purity confirmed by chemical and QEMSCAN analyses); s 6.2 (2D stereological bias); ss 7–8 (QEMSCAN and MLA against micro-CT).
- PRIMARYSchulz, B., Sandmann, D. and Gilbricht, S., 'SEM-Based Automated Mineralogy and its Application in Geo- and Material Sciences', Minerals 10(11), 1004, 2020. Peer-reviewed review, open access. p. 14: leucoxene and rutile not properly distinguished by EDS and XRD spectra.
- SECONDARYBirtel, S., Tolosana Delgado, R., Bachmann, K., Heinig, T., Gutzmer, J., Matos Camacho, S. and van den Boogaart, K. G., 'How to use a MLA correctly', poster, Gordon Research Conference, Geochemistry of Mineral Deposits, 19–24 June 2016. Abstract in the HZDR publications record: stereological distortion; cutting effects on grain size; precision against accuracy.